Launching on TradingView soon. Join the early-access list to hear the moment it launches.
CheckInTraderTRADING INDICATORS
Rule-based TradingView indicators for traders who haven't got all day

Trade the plan.
Not the screen.

CheckInTrader indicators find the setups, plot the entry, stop and trailing levels, and alert your phone when a candle closes. You check in and make the call.

Get early access See a real setup

No credit card · Launch updates only · Unsubscribe anytime

Educational charting tools. Not financial advice.

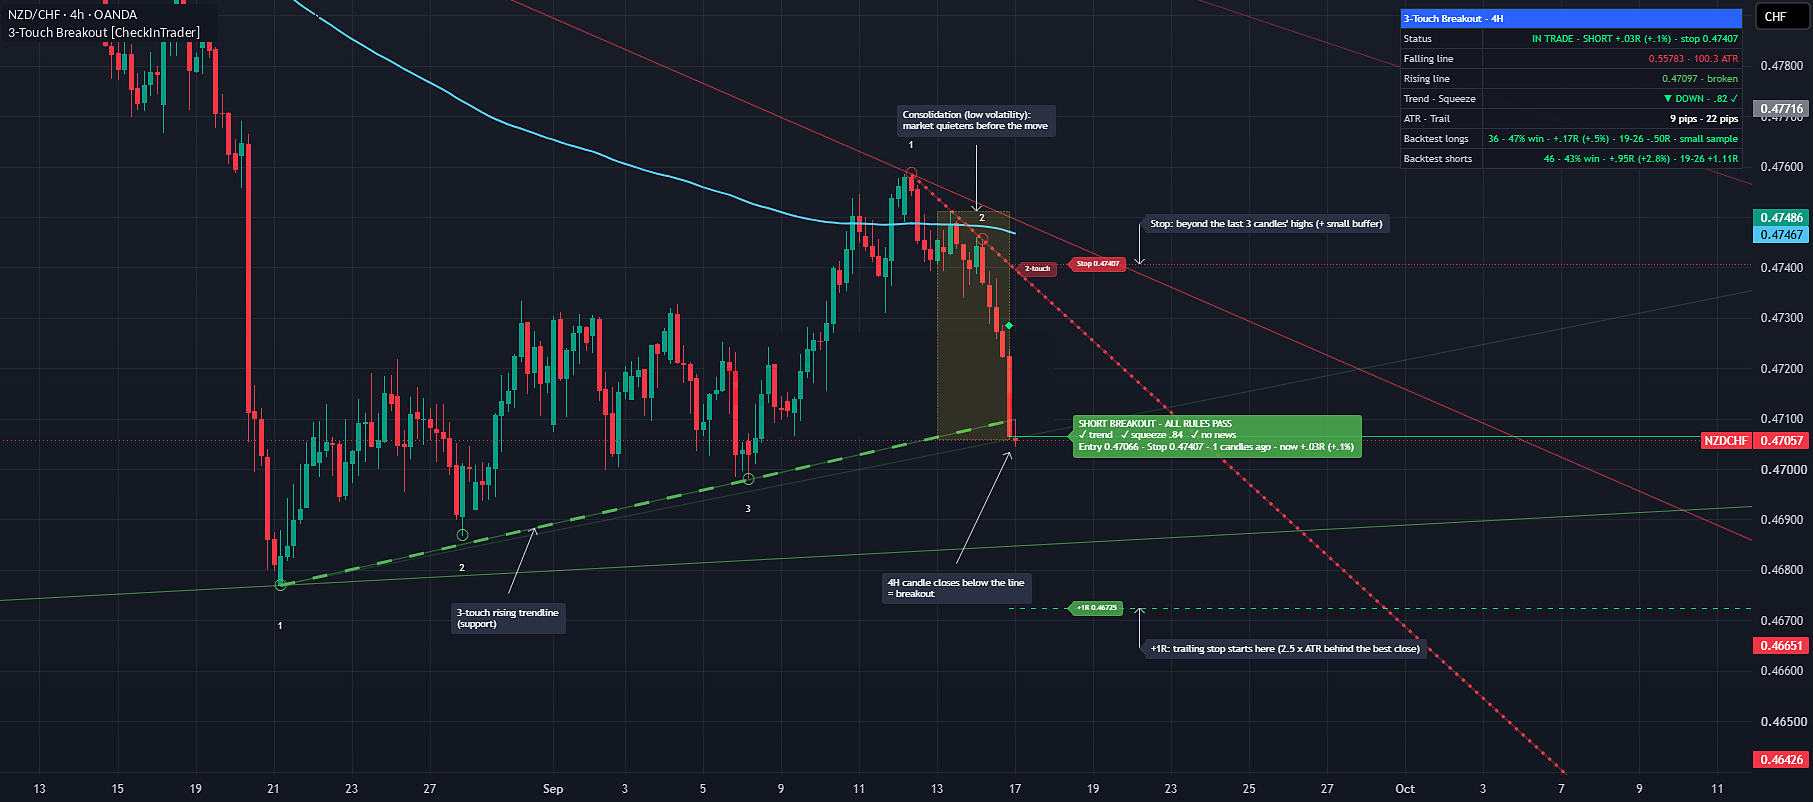
NZDCHF · 4H · Auto 3-Touch Trendline Breakout
SHORT · ALL RULES PASS
NZD/CHF 4-hour chart with the indicator: a rising 3-touch trendline is broken, the short breakout passes all rules, and the stop, +1R level and info panel are shown
TradingView alertnow
NZDCHF 4H trendline breakout - ALL RULES PASS
Close 0.47066 · Check the chart for entry/stop
+21R/yr
Breakout average, backtest 2005–2025
70%
of Dip Buyer trades were winners, backtest
15/mo
About 15 setups a month across the indicators
21 yrs
Of data tested, spreads included
EURUSDGBPJPYAUDUSDUSDJPYNZDCHFSPX500NAS100US30DE30JP225XAUUSDXAGUSDBTCUSD+ more

Backtested results. Past performance is not a reliable indicator of future results.

THE OLD WAY VS THE CHECK-IN WAY

Get your Sundays back

Top-down analysis, morning chart sweeps, working out stops by hand. The indicators now do the chart work, the same way every time.

THE OLD WAY

Hours at the charts

Sunday top-down analysis, morning sweeps, a check at every 4-hour close, and the closes you sleep through.

Screen time
Hours
most days of the week
MON9
6:00–9:30am Chart check & redraw lines (7am close)
11:00am 4H close check
3:00pm 4H close check
7:00pm 4H close check
11:00pm 4H close missed · asleep
TUE10
6:00–9:30am Chart check & redraw lines (7am close)
11:00am 4H close check
3:00pm 4H close check
7:00pm 4H close check
11:00pm 4H close missed · asleep
WED11
6:00–9:30am Chart check & redraw lines (7am close)
11:00am 4H close check
3:00pm 4H close check
7:00pm 4H close check
11:00pm 4H close missed · asleep
THU12
6:00–9:30am Chart check & redraw lines (7am close)
11:00am 4H close check
3:00pm 4H close check
7:00pm 4H close check
11:00pm 4H close missed · asleep
FRI13
6:00–9:30am Chart check & redraw lines (7am close)
11:00am 4H close check
3:00pm 4H close check
7:00pm 4H close check
11:00pm 4H close missed · asleep
SAT14
Markets closed
SUN15
12:00–6:00pm Top-down analysis weekly → daily → 4H every market
7:00pm Write the watch list
WITH CHECKINTRADER

Check in when it matters

Five alerts across breakouts, dips and metals. Everything you need is already on the chart.

Screen time
7 min
for the whole week
MON9
7:00am SPX500 dip 1 min
TUE10
3:00pm EURUSD breakout 2 min
WED11
11:00am Gold momentum 1 min
THU12
7:00am SPX500 exit level 1 min
FRI13
7:00pm GBPJPY breakout 2 min
SAT14
Markets closed
SUN15
FREE

Example week. Alerts arrive when a 4-hour or daily candle closes, so times depend on your time zone.

Built to save time, not to tell you what to trade. The indicators do the repetitive chart work, finding the lines, checking the rules and plotting the levels, so traders with busy lives can review a setup in minutes and make their own decision.

Sunday prep
HoursNone
Chart checks
Every morningWhen an alert fires
Stops and trail
By handDrawn for you

HOW IT WORKS

Three steps. A few minutes when it matters.

STEP 01

Set your alerts once

Add the indicator to your TradingView charts, adjust the settings if you want, pick the "all rules pass" alert and set it to once per bar close.

STEP 02

Check in when one fires

Get on with your day. Your phone tells you when a setup confirms at the candle close.

STEP 03

Decide in a minute

The line, which rules pass, the entry, stop and +1R level are already on the chart. You make the call.

THE REAL ALERT WINDOW

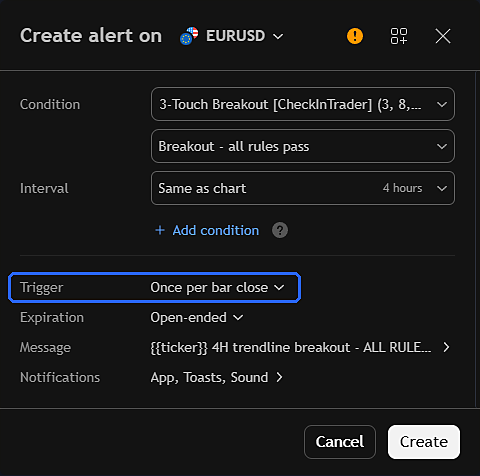
Set up in under a minute

Three settings, once per chart. After that your phone does the watching.

  1. 1Condition: pick "Breakout - all rules pass"
  2. 2Trigger: once per bar close, so it only fires on a confirmed close
  3. 3Notifications: turn on the app, and every alert lands on your phone with the market and the close price
TradingView create-alert window with the condition set to the 3-Touch Breakout indicator, Breakout - all rules pass, and the trigger set to once per bar close 123

A REAL SETUP, STEP BY STEP

Breakout, hold, then the trail does the work

NZD/CHF on the 4-hour chart. Screenshots straight from TradingView, nothing redrawn.

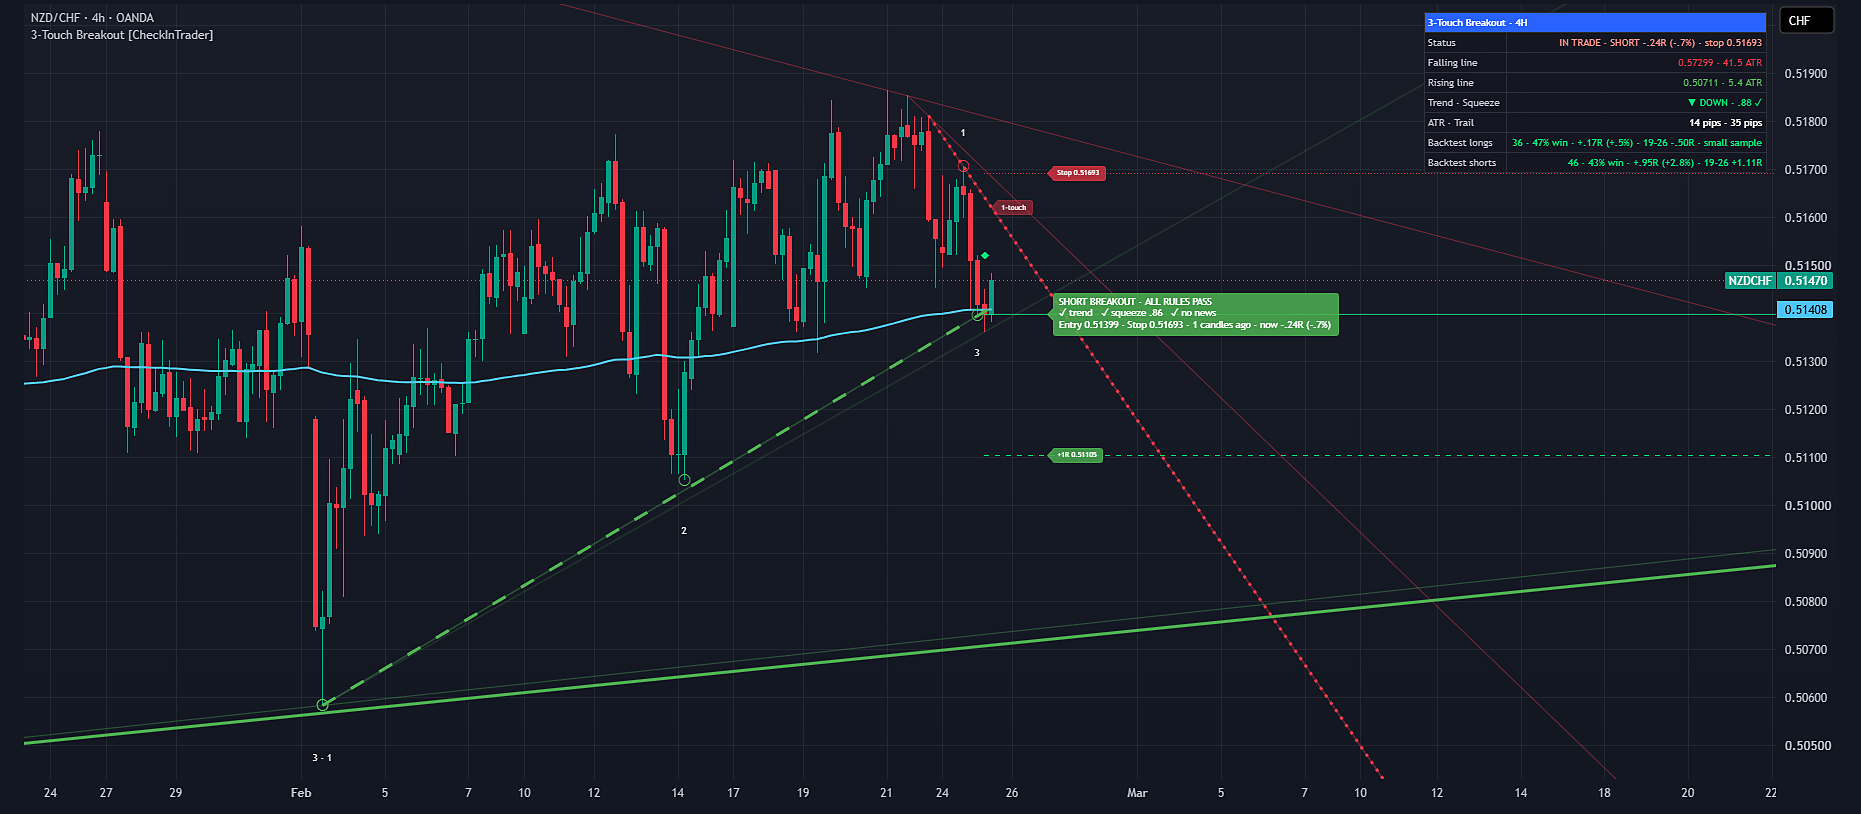
Step 1: the short breakout passes all rules; the next candle closes back above the line but the stop has not been hit
STEP 1The next candle closes back above the line, but the stop hasn't been hit, so the setup is still active.
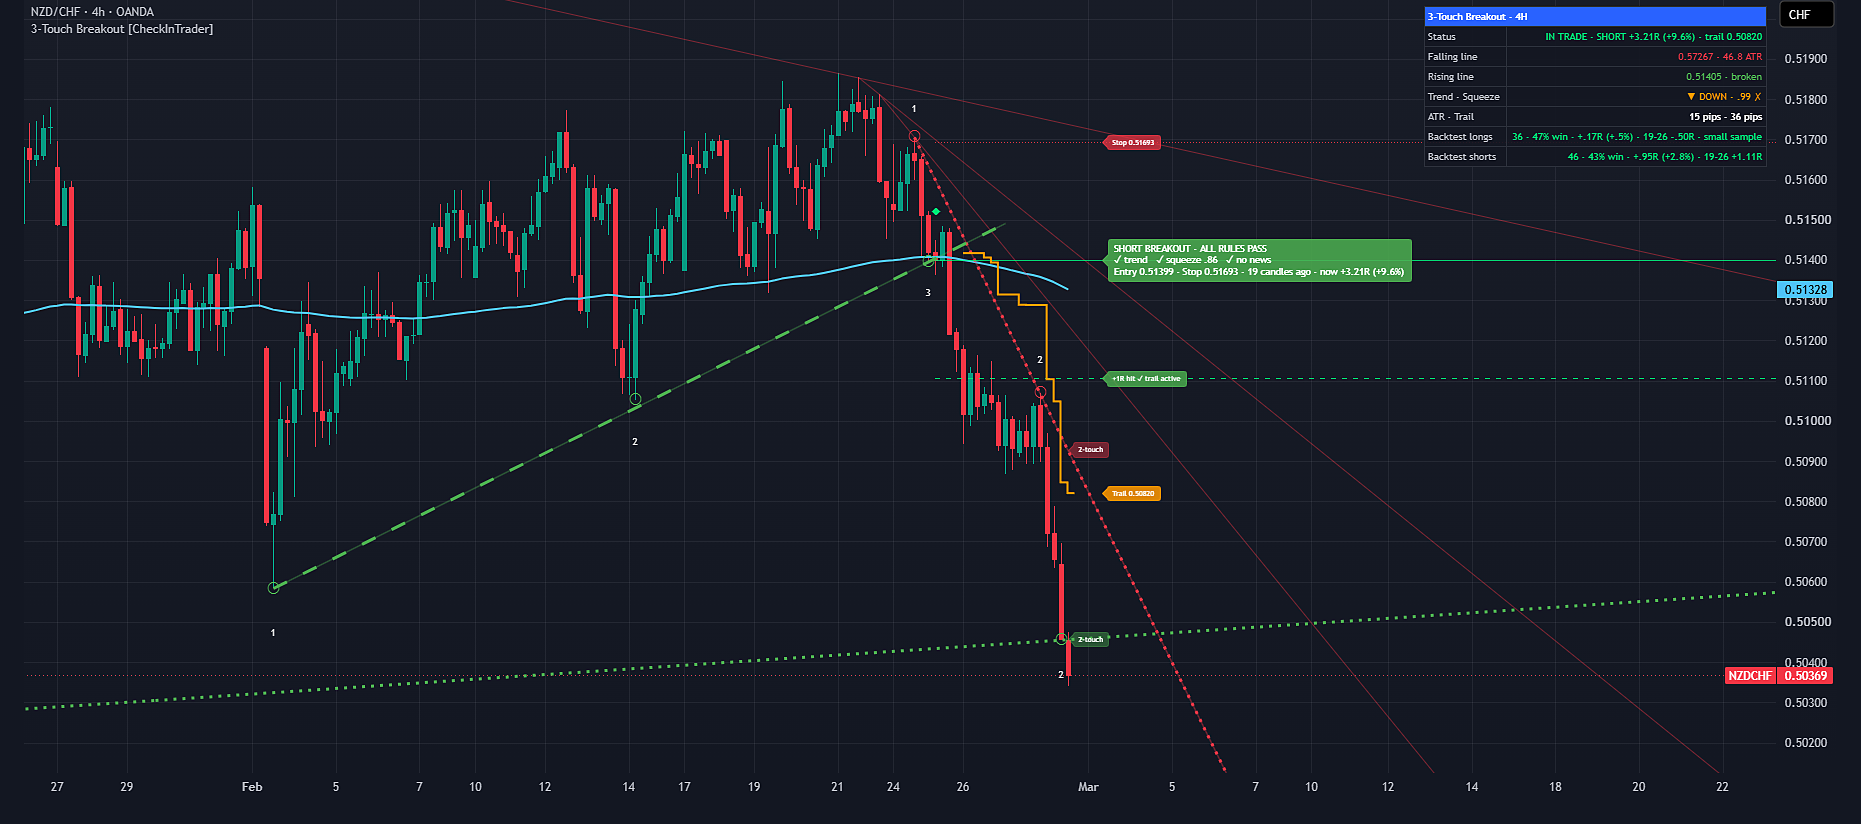
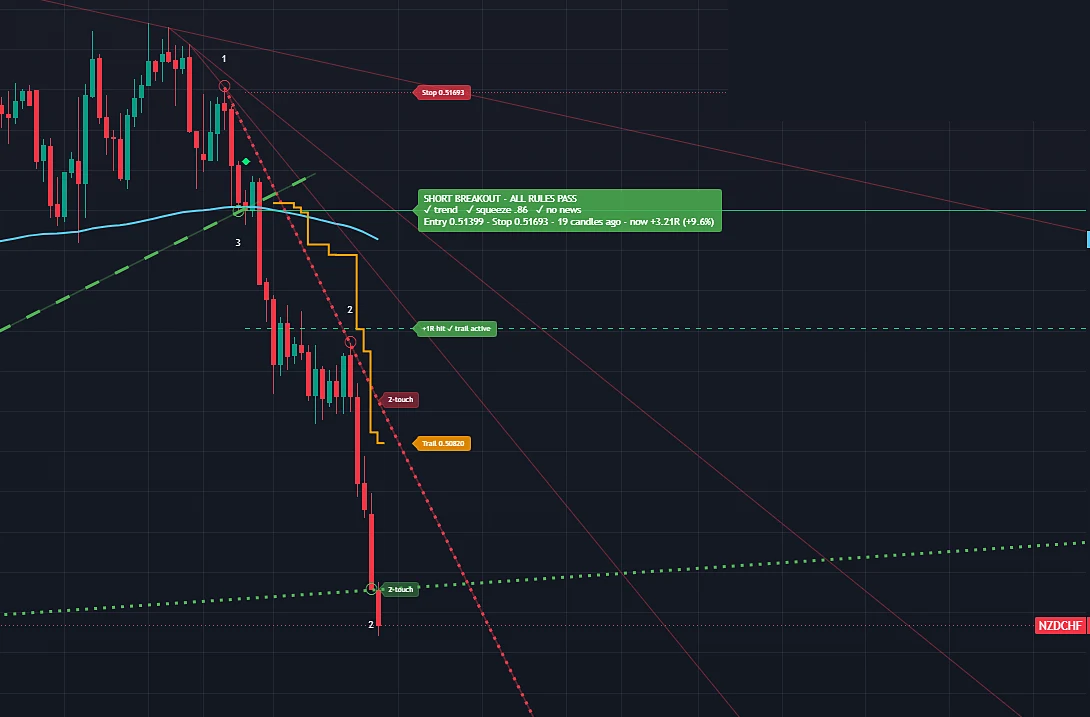
Step 2: a few days later, +1R is hit, the orange trailing stop follows price down and the trade is at +3.2R
STEP 2A few days later: +1R hit, the orange trail is running, now +3.2R.No fixed target. The trail lets winners run.

One example setup, chosen to show how it works.

Follow live setups on TradingView

Setups posted as they happen, winners and losers alike.

THE INDICATORS

Four strategies. Different markets. One routine.

Compare all indicators →
123ENTRYSTOP+1RLONG BREAKOUT · ALL RULES PASS✓ trend ✓ squeeze .84 ✓ no newsTRAIL3-Touch Breakout · 4HStatusIN TRADE · +2.4RFalling linebrokenTrend · Squeeze▲ UP · .84 ✓
AVAILABLE AT LAUNCHForex, metals, indices, crypto · 4H

Auto 3-Touch Trendline Breakout

The lines draw themselves. You get an alert when a 4-hour candle closes through a line touched three or more times.

8–10 setups / month+21R a year, backtest28 markets tested
  • Scans up to 8,000 candles for long-running lines
  • Trend, squeeze and news filters on every break
  • Entry, stop, +1R and a trailing stop drawn for you
See the Breakout →
RSI 9.8EXIT +1.27RSTOP 2×ATR200-day avg10-day avgIndex Dip Buyer · DailyLast trade+1.27R · 10-day exitRSI(2) · 200-day58 · +4.1% aboveHistory on chart70% win
AVAILABLE AT LAUNCH7 stock indices · Daily

Index Dip Buyer

Spots sharp, short pullbacks in rising stock indices, and marks the exit level when the bounce comes.

70% winners, backtest5 setups / month4 day average hold
  • Only signals when an index is above its 200-day average
  • Signal when RSI(2) closes below 10, confirmed at the daily close
  • Exit-level alert on the first close above the 10-day average
See the Dip Buyer →
LONG+1R · STOP TO BREAKEVENTRAILENTRYMACD 12 26 9 · cross above zeroMetals Momentum · 4HStatusIN TRADE · +3.1RTrendrising ✓Stoptrailing · 2.5 ATR
IN LIVE TESTINGGold & silver · 4H

Metals Momentum

Catches momentum in gold and silver when the long-term trend is rising, then lets the winners run.

60% gold wins incl. breakeven, backtest18 setups / year2 metals
  • Signals a MACD cross above zero in a rising trend
  • Stop moves to breakeven once +1R is reached
  • Trailing stop tuned separately for gold and silver
Get notified at launch →
200-day trend100-candle highStop 1.5 ATRLONG BREAK · new highBreakeven at +1RTrailing stopBTC Trend Breakout · 4HStatusIN TRADE · +3.6RTrend▲ UP ✓Stoptrailing · 4 ATR
IN LIVE TESTINGBitcoin · 4H

Bitcoin Trend Breakout

Follows Bitcoin's big trending moves, long or short, with a 1.5 ATR starting stop and a trailing stop.

+14R a year since 2018, backtest10 setups / yearLong & short
  • Signals a new 100-candle high or low in the direction of the 200-day trend
  • 1.5 ATR stop, moved to breakeven at +1R
  • Trailing stop lets the big runs pay for the small losses
Get notified at launch →

Backtested results. Past performance is not a reliable indicator of future results.

BUILT IN

Everything on one panel

The trade, the rules and the history, right on your chart.

  1. 1Setup status
    Waiting, breakout or in trade, with R and account % at your risk
  2. 2Where the lines are
    Both trendlines, and how far price is from each in ATR
  3. 3Do the filters pass?
    Trend and squeeze checked on every 4-hour close
  4. 4How it's done before
    Backtest for this exact market, longs and shorts separately
No repaintingAlerts built in
Real NZD/CHF 4-hour chart: a rising 3-touch trendline breaks, the short passes all rules and the orange trailing stop follows price down
1234

Backtest figures are different for each market and direction.

WHY MORE THAN ONE

When one goes quiet, another often isn't

Forex breakouts, index dips and metals trends behave differently, so their bad months rarely line up.

1 in 24months where Breakout, Dip and Metals all lost together

Losing months still happen. Combined, Breakout, Dip and Metals were down in 10 of these 24 months. The point is that one strategy's bad month is usually softened by the others.

Backtest, month by monthNov 2024 → Oct 2026
Nov 24
Dec 24
Jan 25
Feb 25
Mar 25
Apr 25
May 25
Jun 25
Jul 25
Aug 25
Sep 25
Oct 25
Nov 25
Dec 25
Jan 26
Feb 26
Mar 26
Apr 26
May 26
Jun 26
Jul 26
Aug 26
Sep 26
Oct 26
Dots: Breakout · Dip · Metals Up Down No trades All three down

HONEST RESULTS

The full numbers. Bad years included.

Every signal taken, spreads included, 2005 to October 2026. Updated every January.

See year-by-year results →

Trendline Breakout

28 markets · 4H
+21Ra year on average
Trades
About 100 a year
Since 2019
+20R a year
Best year
+79R (2008)
Losing years
2006, 2016, 2024
Largest drawdown
About 37R
Longest losing run
16 trades

Losses are kept to about 1R, and the trailing stop lets the big runners pay for the small losses.

Index Dip Buyer

7 indices · Daily
70%of trades were winners
Average year
+8.7R
Since 2019
+5.6R a year
Trades
About 61 a year
Losing years
2008, 2018, 2020, 2022
Largest drawdown
About 30R
Average hold
About 4 days

Wins average about +0.6R and losses about −1R, so the high win rate matters.

Every year, in R

Backtest, 2005 to Oct 2026 · not compounded · spreads included, overnight financing not included · *2026 is January to October

Trendline BreakoutIndex Dip Buyer
−40R−20R0R+20R+40R+60R+80R2005: Breakout +5R2005: Dip Buyer +19R2006: Breakout -9R2006: Dip Buyer +12R20062007: Breakout +30R2007: Dip Buyer +13R2008: Breakout +79R2008: Dip Buyer -4R2009: Breakout +5R2009: Dip Buyer +17R20092010: Breakout +57R2010: Dip Buyer +3R2011: Breakout +59R2011: Dip Buyer +6R2012: Breakout +4R2012: Dip Buyer +22R20122013: Breakout +29R2013: Dip Buyer +20R2014: Breakout +0R2014: Dip Buyer +8R2015: Breakout +13R2015: Dip Buyer +8R20152016: Breakout -29R2016: Dip Buyer +7R2017: Breakout +26R2017: Dip Buyer +31R2018: Breakout +21R2018: Dip Buyer -18R20182019: Breakout +45R2019: Dip Buyer +2R2020: Breakout +18R2020: Dip Buyer -9R2021: Breakout +14R2021: Dip Buyer +7R20212022: Breakout +31R2022: Dip Buyer -8R2023: Breakout +16R2023: Dip Buyer +12R2024: Breakout -4R2024: Dip Buyer +16R20242025: Breakout +23R2025: Dip Buyer +18R2026: Breakout -14R2026: Dip Buyer +9R2026*+79R−29R
Breakout years in profit
18 of 21
Dip Buyer years in profit
17 of 21
Both together
20 of 21 years in profit
Worst year
About −29R (Breakout, 2016)

R = the amount risked on a trade. At 1% risk per trade, +1R is about +1% of the account, before compounding. Results include spreads but not overnight financing, which varies by broker and account; on typical CFD rates it lowered the averages to about +16R a year for the Breakout and +6.3R for the Dip Buyer. Backtests are hypothetical and not a forecast; live results are likely to be lower.

Backtested results. Past performance is not a reliable indicator of future results.

[Photo of Nathan]

WHY I BUILT IT

"The method worked. The time it took didn't."

I've traded 3-touch trendline breakouts on the 4-hour chart for years. Every Sunday I'd do a full top-down analysis, weekly to daily to 4-hour, then spend hours each morning going back through the list and redrawing lines. I don't have all day to sit at charts.

So I turned the way I read the charts into fixed rules and built indicators to do the chart work. Now there's no Sunday prep and no morning chart sessions. When an alert fires, I check in, decide, and get on with my day.

Nathan
Founder, CheckInTrader

PRICING

One plan. Every indicator.

US$29.95 a month for every indicator, including new ones as they launch. Cancel anytime.

CheckInTrader Pro

EVERY INDICATOR INCLUDED
US$29.95/ month

Less than $1 a day

Billed monthly through TradingView · Cancel anytime

  • Auto 3-Touch Trendline Breakout (4H)
  • Index Dip Buyer (Daily)
  • Metals Momentum when it launches
  • Bitcoin Trend Breakout when it launches
  • Step-by-step setup and alert guides
  • Backtest figures refreshed every January
Join the waitlist

For education only. No results are guaranteed.

FAQ

Questions, answered

Something else? Get in touch.

Do the signals repaint?+

No. Breakouts and dip signals are confirmed at the candle close and stay fixed. Only the dotted watch line can shift as new swings form.

Does it place trades for me?+

No. The indicators are charting tools. They never connect to your broker or place orders. You decide whether to trade, and you place every trade yourself with your own broker.

What if I miss the candle close?+

The backtests enter at the candle close. If you see an alert late, the breakout level and stop are still on the chart, so you can judge it for yourself. How and when you enter is always your call.

Which TradingView plan do I need?+

Anyone on TradingView can subscribe, including free accounts. To get alerts on your phone, you'll need a paid TradingView plan, because the free plan doesn't include indicator alerts. Each alert covers one market: Essential allows 20, enough for the main markets; Plus allows 100, enough to cover every market and indicator.

Are the results guaranteed?+

No. Backtests show how the rules behaved in the past, including the losing years. Live results are likely to be lower because of costs, missed trades and slippage.

Can I change the settings?+

Yes. The main settings, like the rule filters, ATR multiples and risk %, can be adjusted. The defaults are the tested values.

Is this financial advice?+

CheckInTrader provides general information and charting tools. It doesn't take your objectives, financial situation or needs into account, so consider whether it suits you and get independent advice if needed.
Stop watching charts.
Start checking in.

Join the early-access list to hear the moment it launches.

By joining you agree to our Terms and Risk warning. We’ll only use your email to tell you about CheckInTrader; see our Privacy Policy.